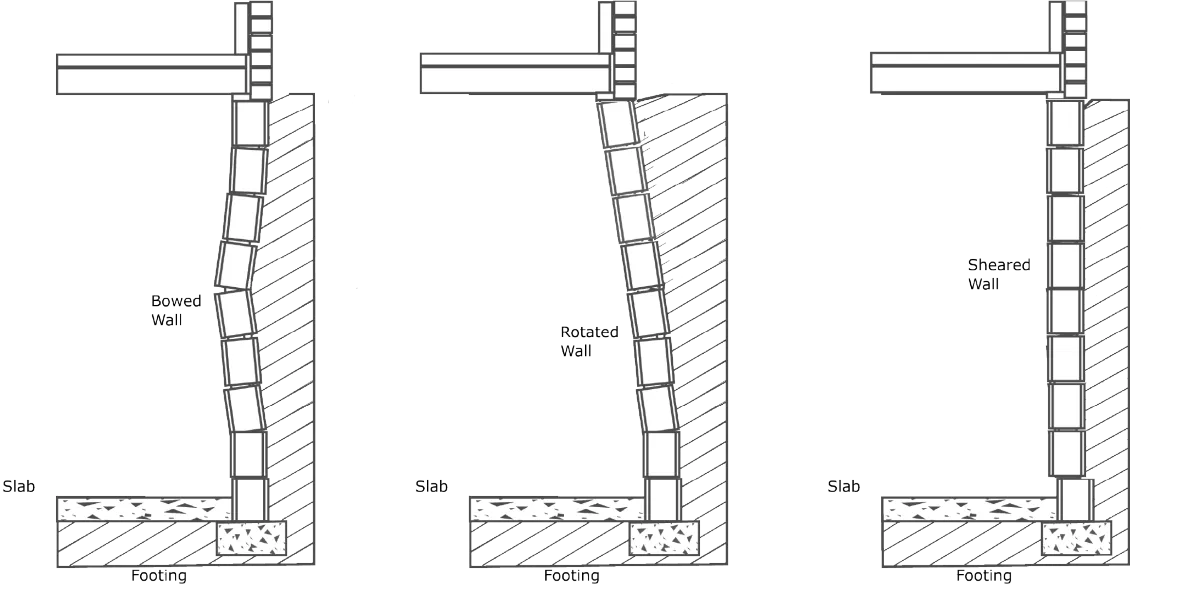
Soil pressure can move basement walls impacting the foundation, sometimes severely. Three common types of basement wall movement are shown in the diagrams.
The Benchmark® Wall Profile report records the shape of the wall and shows it in a heatmap.
Key Benefits:
Shows the entire wall as a single unit.
Monitors changes over time, which may be critical if repairs are postponed.
Rotated walls, the middle diagram, frequently cause a parallel shift in the opposite wall. The multi-wall wall profile report monitors up to 4 walls.
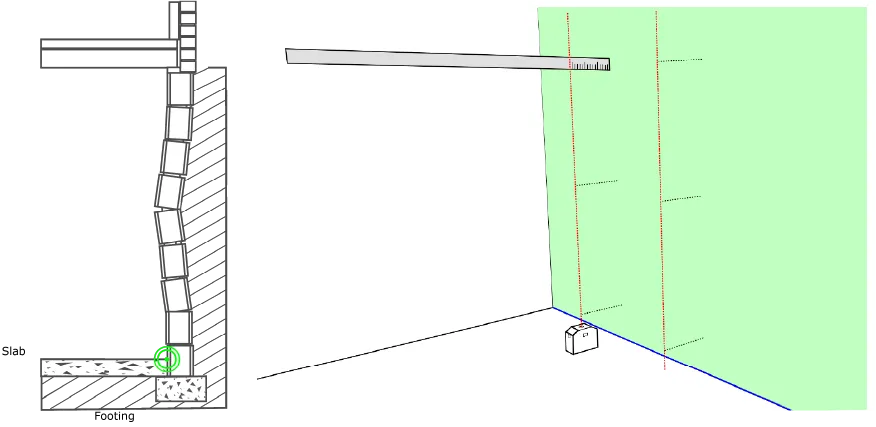
A bowed wall is shown at the far left. The slab and the footing and first row of blocks are held in place by the soil. So, the line where the first block and the slab meet, highlighted by the bullseye, is the original as-built construction line. That line is shown in blue in the next diagram. The distance between the as-built line and the wall defines the shape of the wall.
A laser and ruler are used to measure distances, and these are entered into the FoundationScan® App. Several vertical lines of data are taken to accurately measure the shape of the wall. (Small holes can be drilled in drywall if the basement is finished.)
Sometimes the first row of blocks sits on top the slab. In this case the first row of blocks can move, and the as-built construction line is estimated using the perpendicular walls.
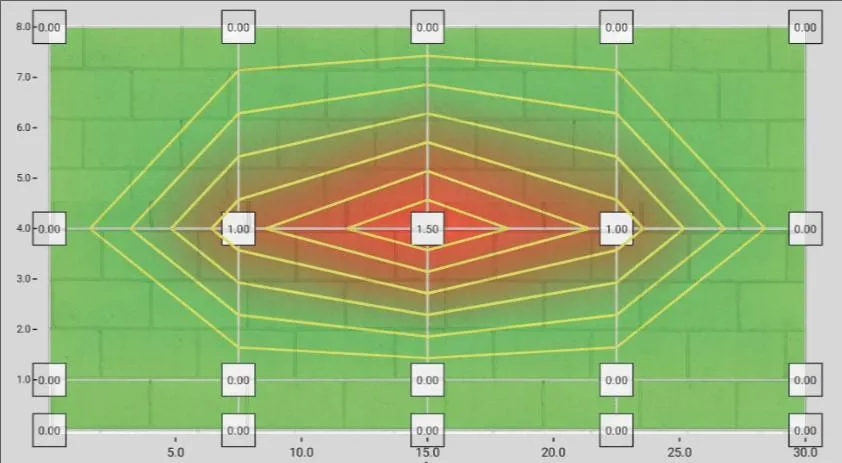
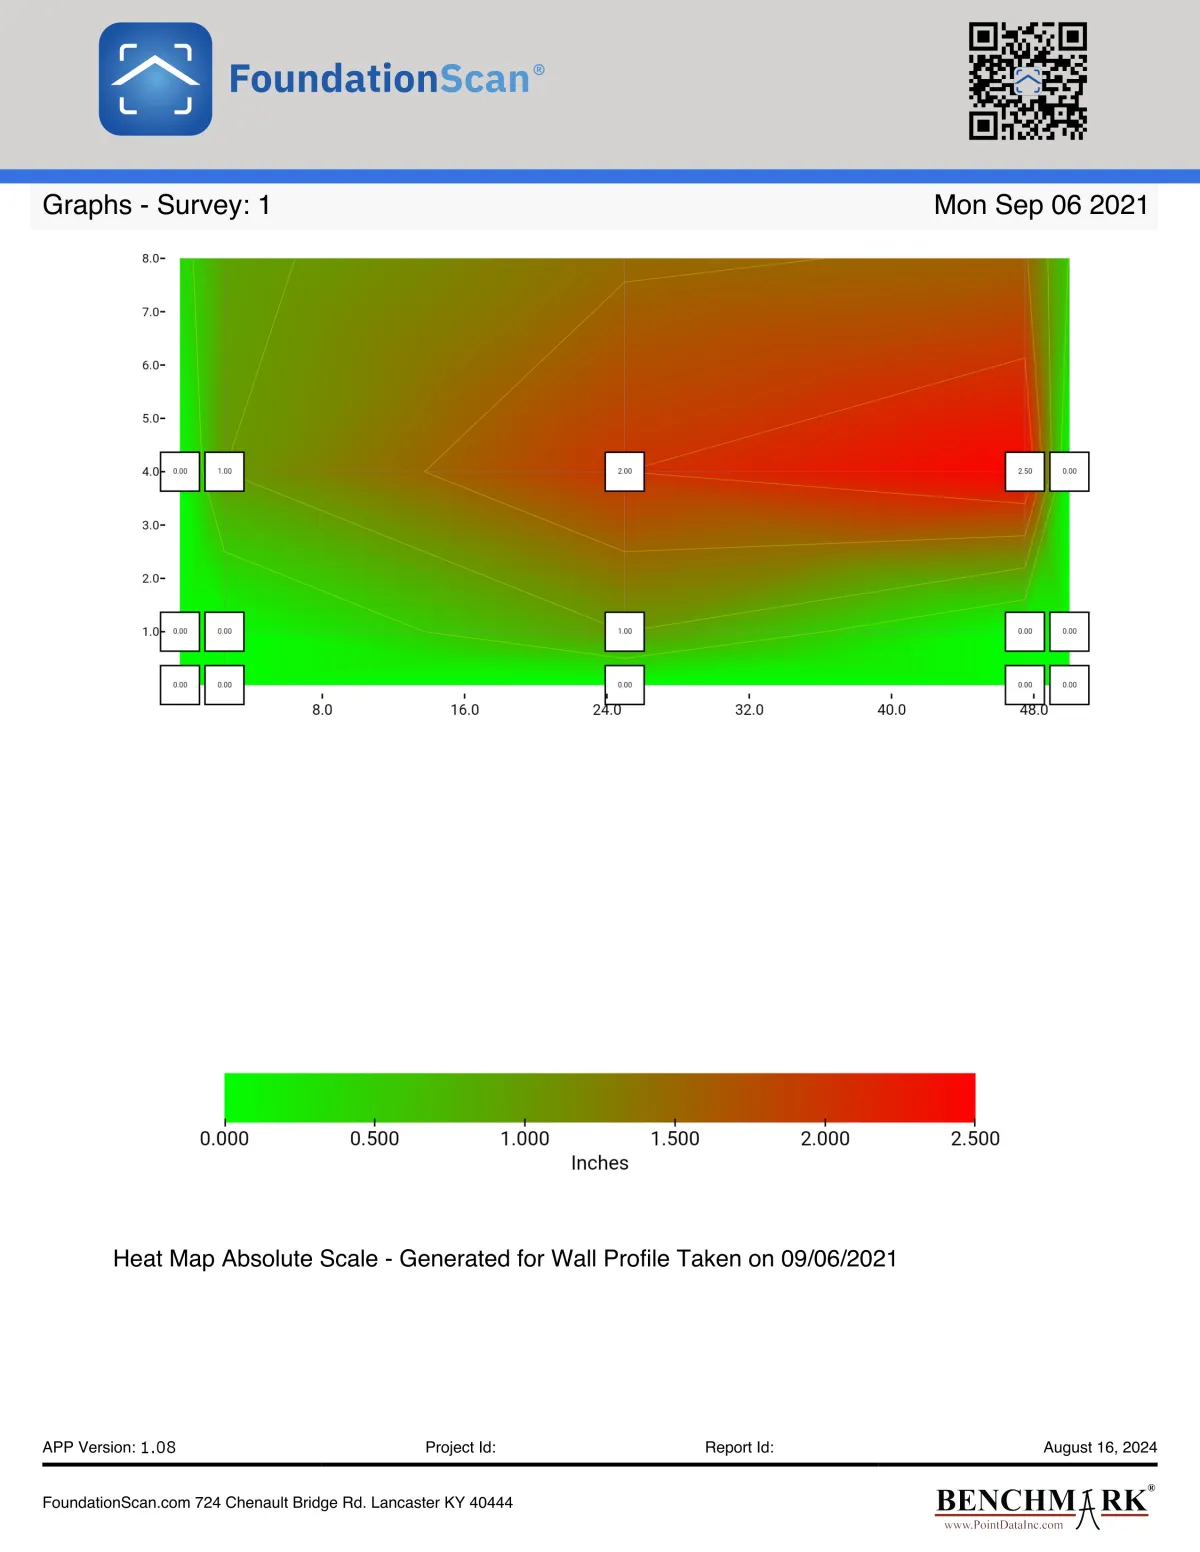
The heatmap to the left is superimposed on a cinder block wall. The map is superimposed on a cinder block background to illustrate the relationship between the wall and the heatmap.
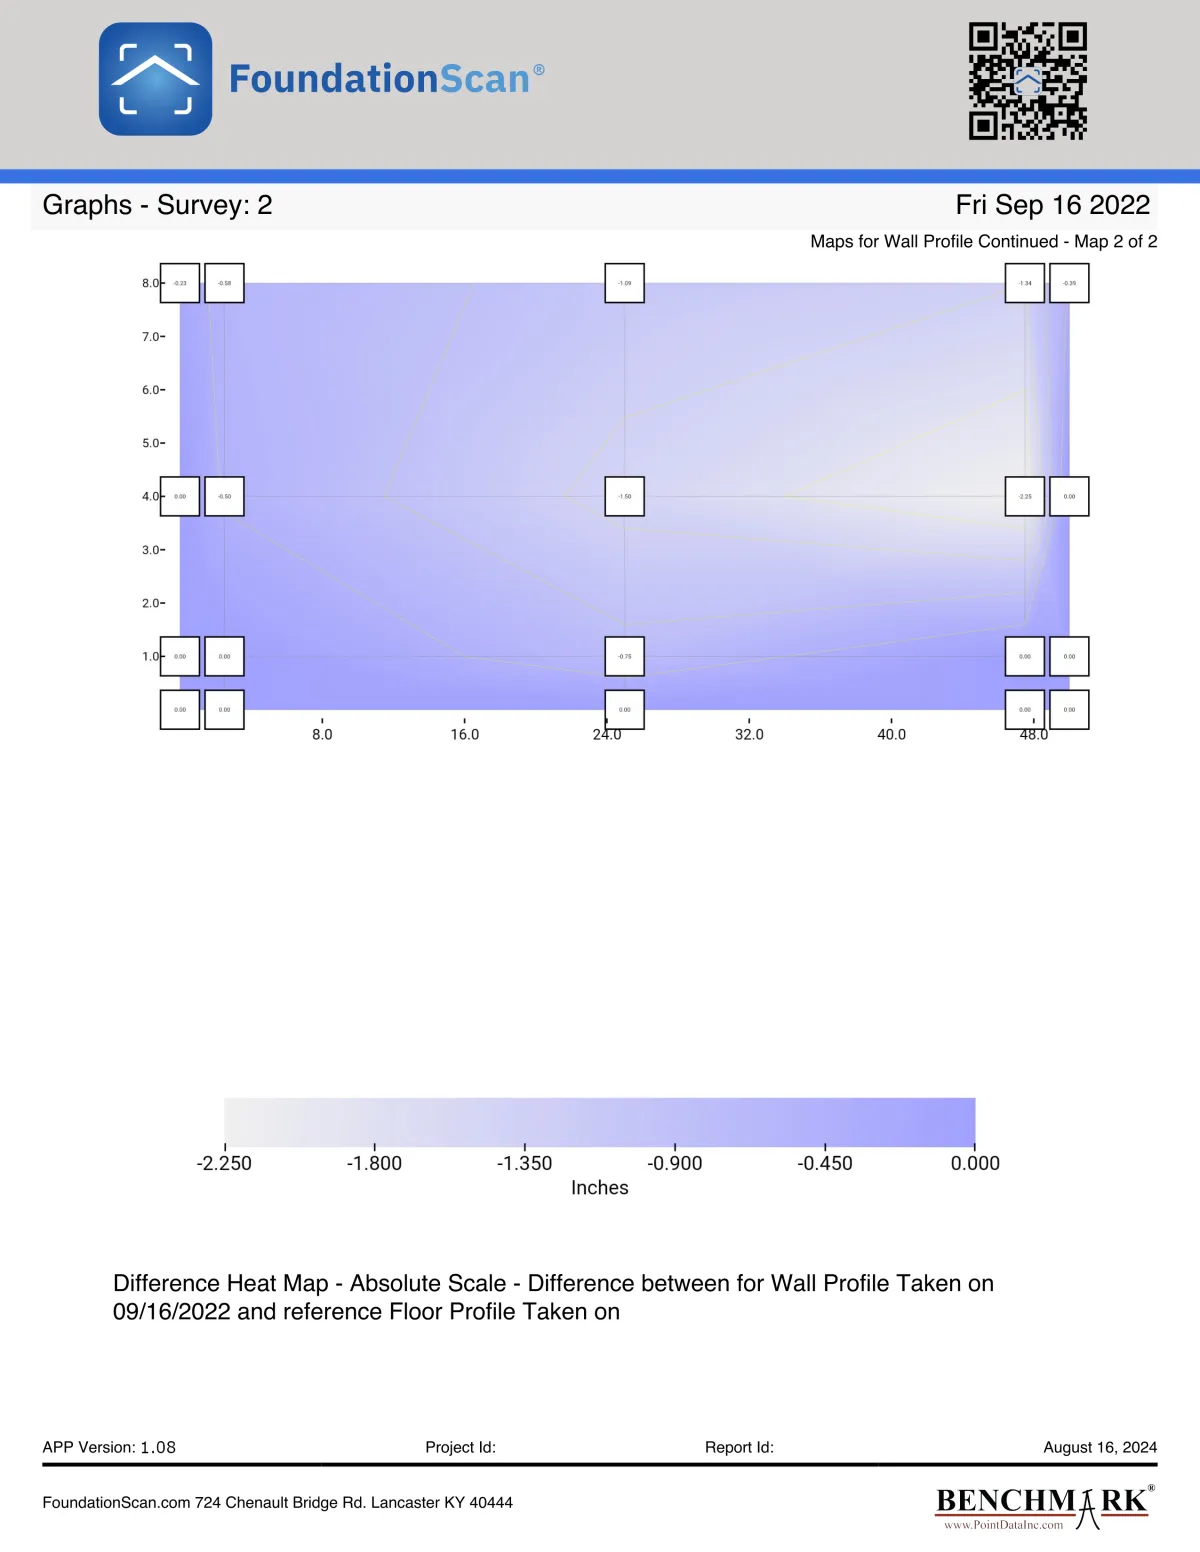
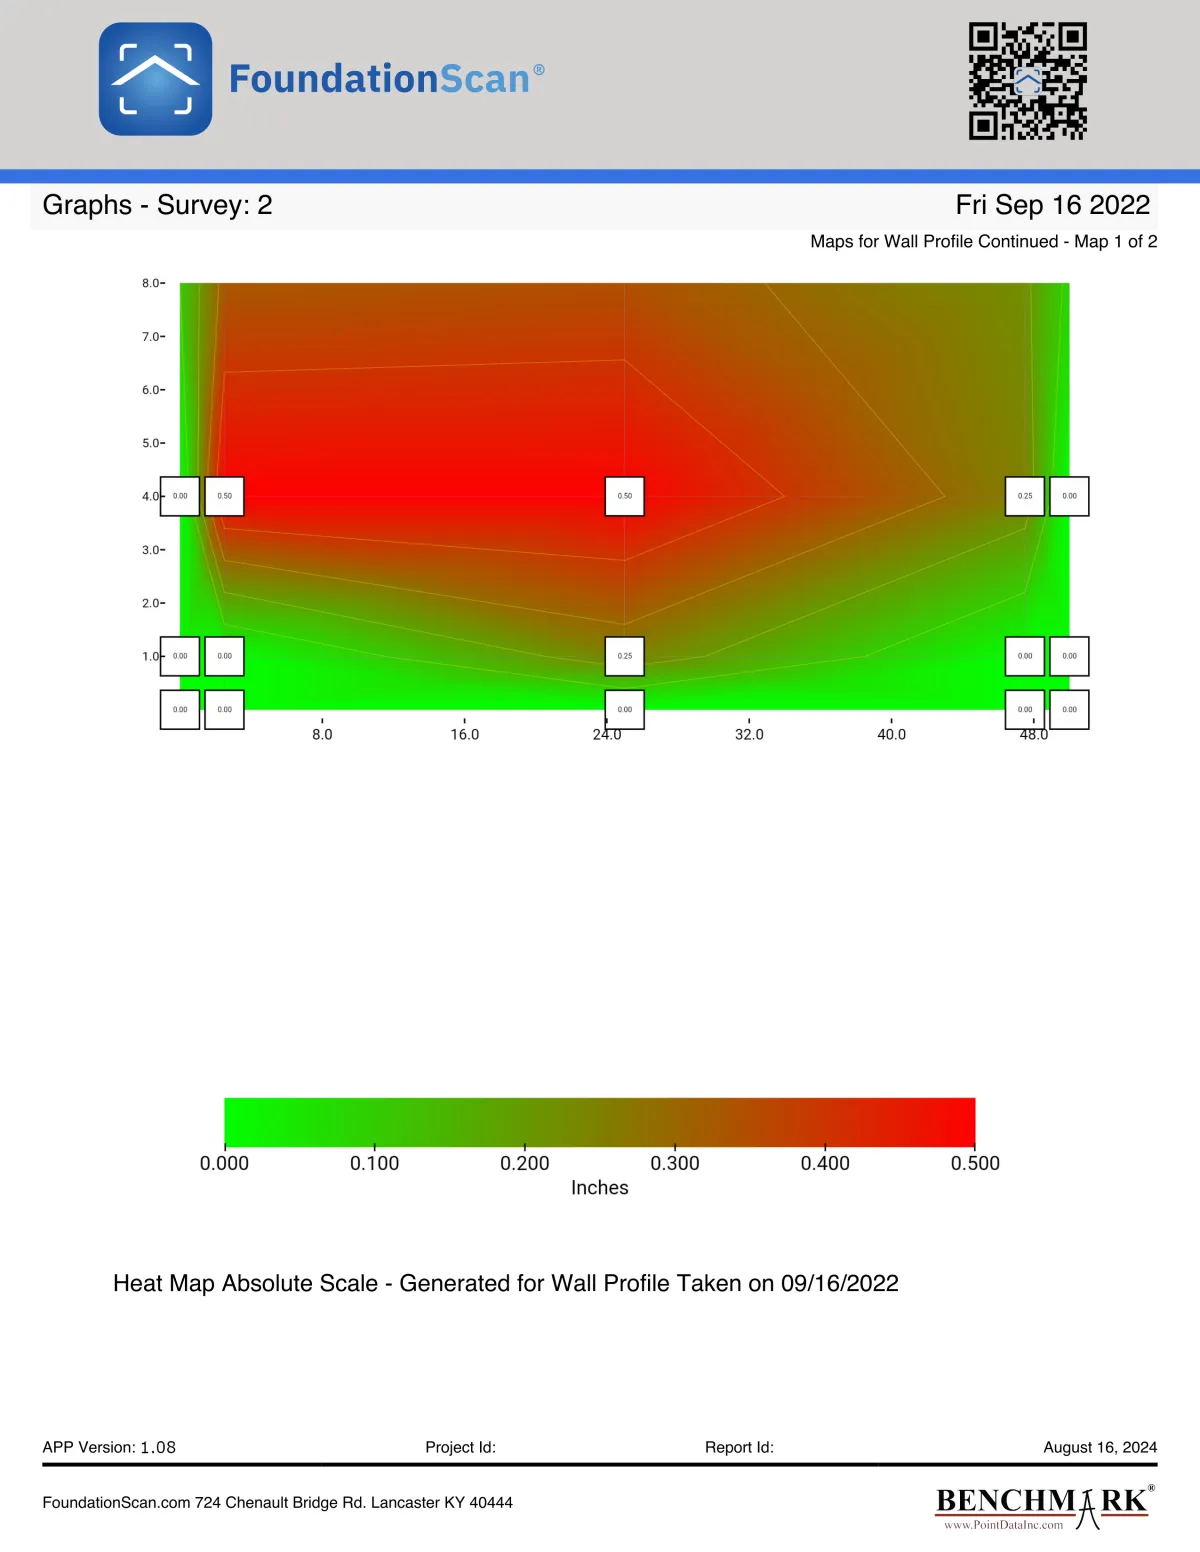
The measurements taken by the technician are shown in the point markers. The vertical lines are along the laser beam used to measure the distances. The App renders the heatmap after the data points have been entered.
The perpendicular walls hold the wall in place at the left and right edges, so the wall tends to bulge in the middle.
Series of data may be taken over time to keep a history of movement to monitor the wall, or to monitor wall stability after any repair.
Three pages from the Benchmark® Wall Profile report are shown. The first heatmap is from a data series taken in September 2021 and the second is from one taken in September 2022. The wall has clearly shifted during that year.
The third page shows the difference between the first and the second data series.
Don’t just take it from us!
CUSTOMER REVIEWS
Six years ago, I was walking around my garden and noticed some stair-step cracks in my brick. I contacted a Benchmark® contractor for a follow up and was elated to learn that the structure had no significant movement since the initial Benchmark® report. The engineer came back and was able to identify a minor easily correctable problem. I had several contractors suggesting to me that necessary repairs could run into the thousands. Knowledge is power and I am grateful I invested in the Benchmark® reports used by FoundationScan®.

Jan / Homeowner
I use Foundation Scan to help my team identify areas that might have been overlooked during diagnosis. With its data-driven insights, we can base our repairs on facts, giving us a powerful tool to present options to customers. For areas that don’t need immediate repair but should be monitored, FoundationScan® builds trust by providing clarity and transparency. It has truly changed our business for the better.

Chris / Foundation Repair Contractor


